


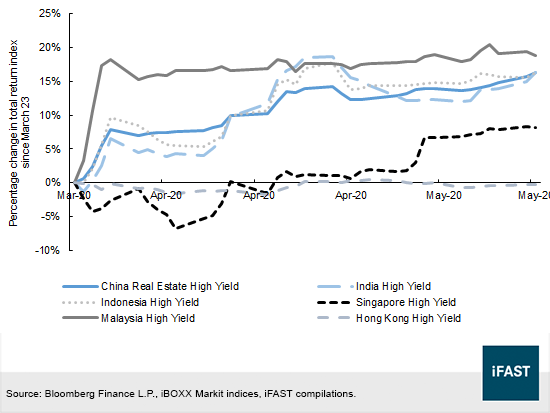
Benchmarks tracking China real estate high-yield bonds have gained nearly 15% since the bottom on March 23 (Figure 1). On a total return basis, Chinese real estate bonds have outperformed many other high-yield sectors in Asia. The positive momentum may continue and this could be an opportune time to look at credits among property developers in China.
Figure 1: Change in total return bond indices since March 23
While there are reasons to be negative on China – uncertain conditions in offshore funding, sharp drop in economic demand and a possible second wave of virus outbreak – the Chinese property sector should be resilient. In fact, we think that bonds of Central China Real Estate Limited (“CENCHI”) are in a sweet spot for high-yield investors.
About Central China Real Estate
CENCHI is incorporated in the Cayman Islands. On 6 Jun 08, the real estate developer filed its initial public offering on the Hong Kong Stock Exchange under the ticker 832:HK. Founded in 1992 by Mr Wu Po Sum, CENCHI has grown to become the market leading developer in the Henan Province. As of 13 Mar 20, the market capitalization of the group was HKD 12.2 billion.
The company was ranked number 40 out of the top 500 Chinese property developers in the “2018 Assessment Report on top 500 Chinese Property Developers”. CENCHI also held the 32nd position in the “2019 Best 50 China Real Estate Listed Companies with Strongest Comprehensive Strengths” and currently holds the highest property market share in 14 out of the 18 prefectural cities in Henan.
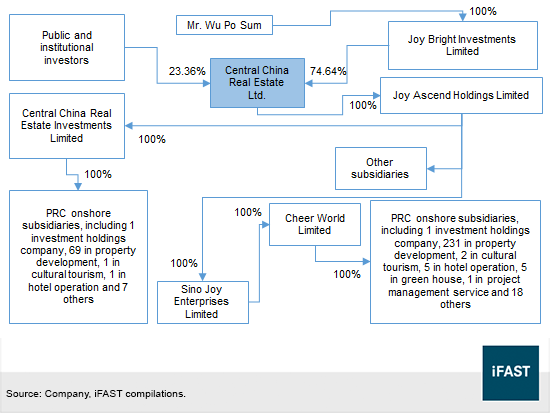
Mr Wu Po Sum owns 74.6% of CENCHI through Joy Bright Investment Holdings. Third-party investors account for the remaining 23.4% of total issued share capital (Figure 2). CapitaLand Limited used to own a 24.09% interest in the developer, but the Singapore property giant sold its equity stake for approximately HKD 2.8 billion (~S$496m) in July last year.
The corporate structure of the firm is complex but important in certain circumstances. With reference to Figure 2, the subsidiaries – Joy Ascend Holdings Limited, Central China Real Estate Holdings Limited, Bumper Up Limited, Artstar Investments Limited, Sino Joy Enterprises Limited, Leapup Limited and Proud Sky Investments Limited – are the initial Subsidiary Guarantor Pledgors of CENCHI’s senior offshore bonds. Senior noteholders are therefore entitled to a first priority lien on the capital stock of the initial Subsidiary Guarantors, pledged by CENCHI and the Subsidiary Guarantor Pledgors.
Figure 2: Corporate structure
Commendable profit margins
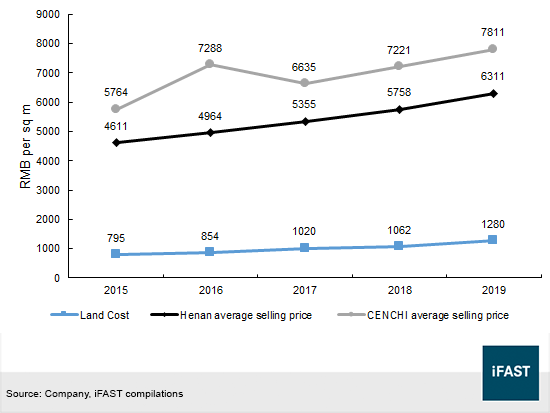
Profit margins are healthy. Land acquisition costs had risen over the past few years but the developer managed to keep average selling prices well above land costs (Figure 3). The difference between average selling prices (“ASP”) and land costs increased from RMB 4,969 per square meter (“sqm”) in 2015 to RMB 6,531 per sqm in 2019.
Despite the growing margin between land costs and ASPs, operating costs have increased considerably and future land acquisitions will likely be maintained at around 32% of contracted sales. The company disclosed that it purchased 13.03m sqm of new land bank at an average of RMB 1,744 per sqm in 2019, and its gross profit margin was 26.0%.
Figure 3: Average selling price and land cost
Large development portfolio
With a majority of its portfolio in residential real estate, CENCHI is inherently exposed to home prices. As at 31 Dec 19, the company managed 206 residential projects that are located across Henan and Hainan (an island province at the southernmost part of China). Residential GFA were mostly focused in Zhengzhou (22.9%), Luoyang (8.5%) and Xinxiang (12.0%). There were also eight commercial projects undergoing development, four of which are located in Zhengzhou (Table 1).
Table 1: Residential and commercial projects under development
|
City |
GFA of commercial projects under development (sqm) |
Number of commercial projects |
GFA of residential projects under development (sqm) |
Number of residential projects |
|
Anyang |
- |
- |
2,112,155 |
13 |
|
Hainan |
- |
- |
900,676 |
6 |
|
Hebi |
- |
- |
752,943 |
5 |
|
Jiaozuo |
- |
- |
1,310,777 |
10 |
|
Jiyuan |
- |
- |
537,086 |
5 |
|
Kaifeng |
72,905 |
2 |
896,305 |
9 |
|
Luohe |
- |
- |
1,453,335 |
8 |
|
Luoyang |
- |
- |
3,089,953 |
15 |
|
Nanyang |
- |
- |
1,291,862 |
8 |
|
Pingdingshan |
- |
- |
1,615,276 |
9 |
|
Puyang |
- |
- |
2,090,284 |
12 |
|
Sanmenxia |
- |
- |
291,527 |
3 |
|
Shangqiu |
- |
- |
2,038,064 |
13 |
|
Xinxiang |
14,266 |
1 |
4,380,054 |
20 |
|
Xinyang |
- |
- |
338,143 |
2 |
|
Xuchang |
- |
- |
2,288,079 |
17 |
|
Zhengzhou |
1,881,829 |
4 |
8,368,404 |
29 |
|
Zhoukou |
42,395 |
1 |
1,596,333 |
15 |
|
Zhumadian |
- |
- |
1,149,408 |
7 |
|
Total |
2,011,395 |
8 |
36,500,664 |
206 |
|
Source: Company, iFAST compilations |
||||
Henan’s housing prices holding well in 2020
Property prices in Henan are still holding up in spite of the recent coronavirus pandemic and lockdown measures. Prices stalled in February as most people stayed at home, but pent-up demand in March likely drove valuations higher after authorities lifted restrictions.
Residential home prices in China were mostly up year-to-date (“YTD”) across cities in the Henan province (Table 2). Our GFA-weighted portfolio, which tracks home prices according to CENCHI’s exposure by gross floor area gained 1.8% YTD after rising 7.8% in 2018 and 3.5% in 2019. Elsewhere in China, prices were down slightly in Beijing but Shenzhen witnessed a modest 1.3% YTD gain. Quite remarkably, home prices in Wuhan, the former epicenter of the virus outbreak only dropped 6% in 2020 and remained higher in value than most states in Henan.
Table 2: Residential prices for Henan and other large Chinese cities
| Average price in May (RMB/sqm) | 2018 change | 2019 change | YTD change | |
| CENCHI GFA-weighted portfolio | 8,349 | 7.8% | 3.5% | 1.8% |
| Jiyuan | 6,264 | 15.5% | 3.8% | -0.4% |
| Zhumadian | 6,699 | -3.0% | 0.8% | 3.3% |
| Zhoukou | 4,988 | 10.6% | 3.6% | 0.0% |
| Xinyang | 6,628 | 0.4% | 2.1% | 1.8% |
| Shangqiu | 5,896 | 10.4% | 0.2% | 4.2% |
| Nanyang | 8,661 | 31.8% | 20.9% | 2.4% |
| Sanmenxia | 5,011 | 4.7% | -1.7% | 0.0% |
| Luohe | 5,858 | 21.6% | 7.8% | 1.8% |
| Xuchang | 6,672 | 2.1% | 5.1% | -0.3% |
| Puyang | 8,004 | 10.7% | 10.1% | 4.8% |
| Jiaozuo | 5,364 | -0.6% | 7.3% | -1.9% |
| Xinxiang | 7,061 | 10.9% | 5.1% | 0.7% |
| Hebi | 7,305 | 16.9% | 5.3% | 3.9% |
| Anyang | 6,255 | 9.5% | 8.1% | 1.7% |
| Pingdingshan | 6,094 | 4.7% | 15.6% | -1.8% |
| Luoyang | 8,890 | 17.3% | 11.5% | 3.0% |
| Zhengzhou | 13,544 | 6.3% | -2.3% | 2.1% |
| Kaifeng | 7,799 | 7.8% | 13.5% | 2.8% |
| Hainan | 4,404 | N.A | -11.3% | -1.1% |
| Wuhan | 15,796 | 8.2% | -4.4% | -6.1% |
| Shenzhen | 55,520 | 2.8% | 3.0% | 1.3% |
| Shanghai | 50,922 | -2.3% | 3.0% | 0.0% |
| Beijing | 58,341 | 4.1% | -2.2% | -0.4% |
| Source: Anjuke.com, iFAST estimates; data as at 11 May 20 | ||||
High concentration in Henan
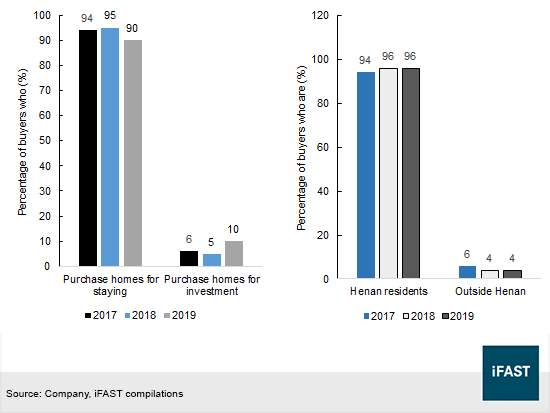
With such a significant presence in the Henan province, the group’s operating performance is heavily linked to the local economy. This is because 96% of CENCHI’s customers are residents who live in Henan, and most homeowners will stay in their purchased properties upon completion (Figure 4).
Figure 4: CENCHI’s customer profile
Provincial economic performance may affect customers’ ability to service mortgage payments as homebuyers are mostly employed by industries within the local economy. CENCHI provides guarantees on mortgage loans taken by customers who purchase properties of the company and its joint ventures. In other words, the group is responsible to repay the outstanding mortgage loans, together with any accrued interests and penalties, if there are any defaults.
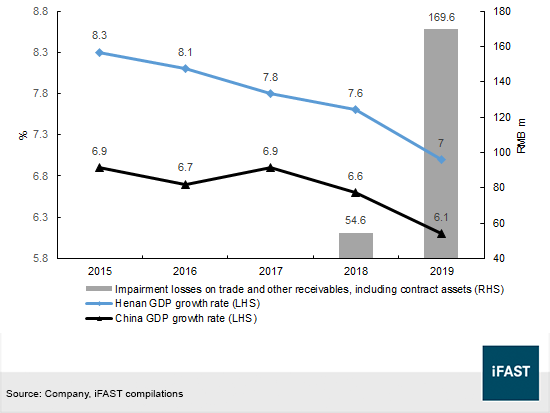
In view of this year’s weak economic growth, impairment losses on trade and other receivables (including contract assets) are likely to increase. Impairment losses have already risen materially in 2018 and 2019, coinciding with the slowdown in GDP growth, both in Henan and the broader Chinese economy (Figure 5).
Unless there is a strong rebound in the second half of 2020, Henan’s GDP growth rate could fall below 7% this year. China’s GDP contracted 6.8% during the first quarter, while Hubei’s (Henan’s neighboring province) economy contracted 40%. With the recent drop in GDP, impairments may follow suit and climb north of RMB 169.6m in 1H20.
Figure 5: Domestic and national GDP growth rates
Business diversification and hospitality operations
In addition to property sales, the group earns revenue from hotel operations, project management services and rental income from investment properties (Table 3). To diversify its business, the company has been expanding its reach into the areas of cultural tourism, green house and light-asset projects.
Light-asset projects are third-party developments that are operated and managed by CENCHI. In return for its service, the group is paid royalty and performance fees that stem from the projects’ profits. As of 31 Dec 19, the firm had secured 163 third-party project contracts with total estimated unrecognized management fees of approximately RMB 2.95 billion, to be recognized over the coming 3-4 years.
Contributions from investment properties and hotels are small in comparison to sale of residential homes. Investment properties primarily consist of schools, kindergartens, retail and commercial units, and parking spaces around Henan.
Hotel revenue increased 13% YoY to RMB 323m last year but the segment recorded operating losses of RMB 3.5m and RMB 1.2m in 2018 and 2019 respectively. Room reservations may have dropped significantly on the back of lockdown measures in 1Q, and the outlook on hospitality revenue in 2020 remains weak even though business activity picked up in April. However, hotel operations only accounted for 1% of total revenue, so the downside impact from hospitality is small in our opinion.
Table 3: Revenue by business segments
|
|
2018 |
2019 |
2018 |
2019 |
|
RMB millions |
Revenue |
Revenue |
As a percentage of total revenue |
As a percentage of total revenue |
|
Sale of properties |
13,629 |
29,161 |
92.2% |
94.8% |
|
Hotel operations |
285 |
323 |
1.9% |
1.0% |
|
Project management service |
675 |
1,023 |
4.6% |
3.3% |
|
Rental income from investment properties |
147 |
163 |
1.0% |
0.5% |
|
Others |
47 |
97 |
0.3% |
0.3% |
|
Total |
14,783 |
30,767 |
100% |
100% |
|
Source: Company, iFAST compilations |
||||
Credit and liquidity discussion
CENCHI has an adequate interest servicing ability. Earnings excluding interest, taxes and investment gains on investment properties (“adjusted EBIT”) more than doubled to RMB 5.4 billion during 2019 (Table 4), and EBIT over interest expense increased from 2.0x in 2018 to 2.4x in 2019. With an assumed borrowing cost of 7.7%, EBIT margin of 17.1% and revenue of RMB 47 billion in 2020, we project EBIT to increase to RMB 8.0 billion this year and interest coverage to improve to 2.8x.
Table 4: Selected financials
|
|
2018 |
2019 |
2020F |
|
Revenue |
14.8 |
30.8 |
47.0 |
|
EBIT |
2.6 |
5.4 |
8.0 |
|
Interest expense |
1.3 |
2.2 |
2.9 |
|
EBIT / interest expense |
2.0x |
2.4x |
2.8x |
|
Source: Company, iFAST estimates. Figures in RMB billions unless indicated otherwise. |
|||
The group’s gearing is high with a debt-to-total capital ratio of 71% at the end of 2019. Borrowings increased by 58.6% to RMB 31.5 billion due to the issuance of USD 1.1 billion senior notes and increase in onshore bank loans. Total shareholders’ equity increased by 22.7% to RMB 12.6 billion, resulting in a debt-to-equity ratio of 2.5x.
However, liquidity is manageable. Unrestricted cash was RMB 22.7 billion at the end of 2019, more than adequate to cover its short-term debt and lease liabilities of RMB 12.6 billion. If need be, we think the group may divest completed properties, properties held for future development, land and a number of other assets to meet financial obligations (Table 5).
Besides mortgage guarantees, CENCHI also guarantees the bank loans and other loans of its joint ventures. Even though management indicated a low likelihood of losses under CENCHI’s financial guarantees, we took these guarantees into our consideration as a part of our liquidity assessment.
Table 5: Value of major assets and liabilities
|
2018 (RMB billions) |
2019 (RMB billions) |
|
|
Unrestricted cash |
14.2 |
22.7 |
|
Restricted bank deposits |
3.6 |
8.1 |
|
Completed properties held for sale |
3.6 |
4.5 |
|
Properties held for future development and under development for sale |
46.6 |
65.2 |
|
Investment property |
2.9 |
3.2 |
|
Biological assets |
0.2 |
0.3 |
|
Interest in associates |
0.4 |
0.3 |
|
Interest in joint ventures |
9.9 |
9.5 |
|
Leasehold land for own use |
0.2 |
0.8 |
|
Building for own use |
2.5 |
2.7 |
|
Deposits and prepayments |
9.2 |
15.1 |
|
Trade and other receivables |
2.6 |
4.4 |
|
Contract assets |
0.1 |
0.2 |
|
Trading securities |
0.1 |
0.1 |
|
Carrying value of assets |
96.2 |
137.2 |
|
Guarantees for mortgage loans provided by banks to customers who bought properties from the company and its joint ventures |
29.5 |
42.4 |
|
Guarantees in respect of bank loans and other loans of joint ventures and an associate |
5.0 |
10.0 |
|
Short-term debt + lease liabilities |
5.3 |
12.6 |
|
Long-term debt + lease liabilities |
14.5 |
19.0 |
|
Contract liabilities |
40.8 |
53.0 |
|
Carrying value of financial and other liabilities (including contingent liabilities) |
95.2 |
136.9 |
|
Source: Company, iFAST estimates |
||
Along with an adequate liquidity profile, CENCHI delivered RMB 551m of positive net cash from operating activities in 2019. Free cash flows were negative RMB 880m after taking into account RMB 1.4 billion of capital expenditures. Nonetheless, CENCHI expects contracted sales receipts of RMB 60 billion in 2020. Net operating cash flow, according to the group’s estimates, will reach RMB 1.75 billion this year.
Bond valuation
CENCHI’s senior notes are issued by the company and guaranteed by a number of its offshore subsidiaries. It is noteworthy that most of CENCHI’s business operations are conducted by the group’s onshore subsidiaries, but none of these subsidiaries are legally allowed to provide a guarantee or a joint-venture subsidiary guarantee for the notes. Furthermore, under certain conditions, certain offshore subsidiaries may be permitted to not provide guarantees for the notes nor have their capital stock pledged to secure the notes. Consequently, we think the offshore senior unsecured notes of CENCHI are effectively subordinated to all the debt and other obligations of non-guarantor subsidiaries, including the onshore subsidiaries.
The issuer is rated Ba3, B+ and BB- by Moody’s, S&P and Fitch respectively. We compared the CENCHI offshore credits to other USD-denominated bonds of similar credit ratings (Figure 6). With bond yields of less than 8.5%, the notes are less attractive than those issued by China Evergrande Group (“EVERRE”). Investors who prefer to invest in a larger Chinese developer may refer to our recently published article – “Evergrande – Entering the Era of Deleveraging” – that explains our positive outlook on the company.
Figure 6: Relative valuation
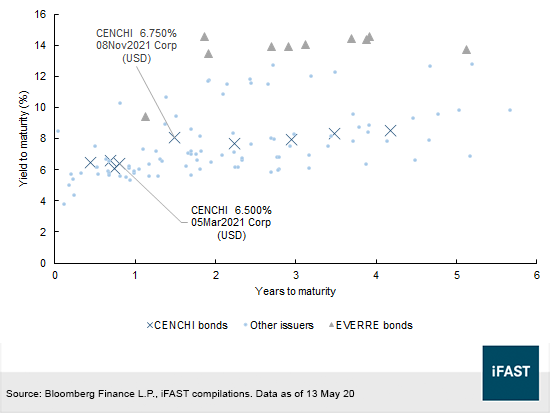
Nonetheless, we think investors should still consider the CENCHI 6.750% 08Nov2021 Corp (USD) in view of the issuer’s low liquidity risk, decent credit performance and good operating cash flows. The indicative yield to maturity on 13 Mar 20 for the CENCHI 6.75% ‘21s was 8.1% respectively.
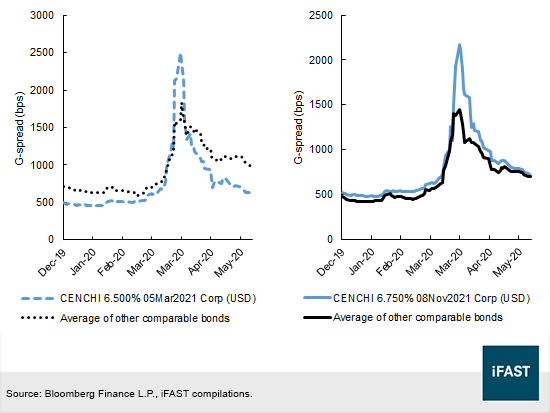
To gauge the attractiveness of the CENCHI 6.75% ‘21s and the CENCHI 6.500% 05Mar2021 Corp (USD) over time, we plotted the credit spreads, or G-spreads of the two bonds next to the average spread of selected credits with similar issue and maturity dates. These G-spreads are measured relative to US Treasuries. As displayed in Figure 7, the CENCHI 6.5% ’21s and CENCHI 6.75% ‘21s had a cheaper valuation in March, but the G-spreads have since dropped from two months ago. At this point, the CENCHI 6.5% ‘21s are trading at a premium over comparable credits, while the credit spreads of CENCHI 6.75% ‘21s have narrowed closer to the average.
Figure 7: Credit spreads since December 2019
Recommended bond: CENCHI 6.750% 08Nov2021 Corp (USD)
Declaration:
For specific disclosure, at the time of publication of this report, IFPL (via its connected and associated entities) holds a principal position in EVERRE 8.250% 23Mar2022 Corp (USD) and EVERRE 7.500% 28Jun2023 Corp (USD). The analyst who produced this report hold a NIL position in the abovementioned securities.









